From Survey Data to Actionable Insights: A Step-by-Step Guide
Learn how to turn survey data into actionable insights with this step-by-step guide, perfect for analysts and marketers.
Introduction
Survey data is one of the most powerful tools available for understanding people’s preferences, behaviors, and opinions. However, collecting responses is only the beginning. The real magic lies in translating raw numbers into insights that drive decisions and strategies. In this comprehensive guide, we’ll walk you through the entire process, from designing a survey to delivering findings that inspire action.
If you want to ensure your survey questions are truly effective, don’t miss How to Write Survey Questions People Actually Want to Answer for practical tips on crafting questions that yield meaningful data.
Designing the Right Survey Questions
Every insightful analysis begins with well-crafted questions. Your survey should align closely with the goals of your project or organization. Avoid leading or ambiguous questions, and make sure each one serves a clear purpose.
For more on avoiding common mistakes that can undermine your results, see Survey Question Mistakes That Are Ruining Your Response Rate.
- Start with your end goals in mind
- Use both closed and open-ended questions
- Pilot test your survey before full deployment
Collecting Survey Data the Smart Way
The quality of your insights will depend heavily on how you collect the data. Make sure your distribution channels match your target audience. Use digital tools for wider reach, and ensure mobile-friendliness for better response rates.
Cleaning and Preparing Survey Data
Before analysis can begin, data must be cleaned and formatted. This includes removing duplicates, correcting errors, handling missing values, and coding open-ended responses.
- Standardize response formats
- Remove invalid or duplicate entries
- Code qualitative responses for analysis
Categorizing and Coding Open-Ended Responses
Open-ended responses can be a goldmine for insights but are often neglected due to their complexity. Use thematic coding to categorize these responses, or leverage tools like natural language processing (NLP) to automate the process.
Analyzing Quantitative Survey Results
Quantitative questions (e.g., Likert scales, ratings, yes/no) should be analyzed statistically. Basic descriptive statistics like mean, median, and frequency distributions reveal trends quickly.
Identifying Trends and Patterns
Beyond averages, look for correlations, anomalies, and patterns. Cross-tabulation is particularly helpful for identifying how different demographics respond differently.
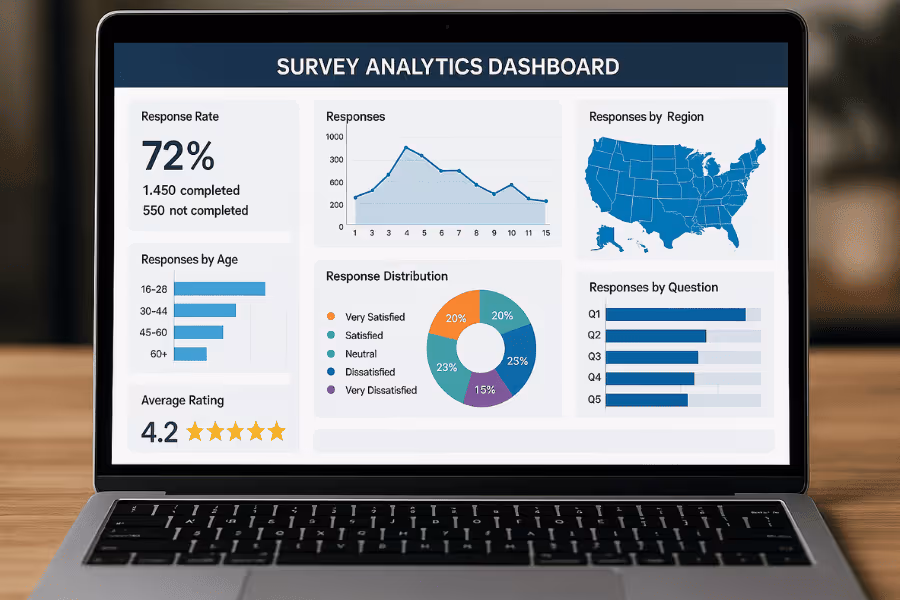
Using Charts and Visualizations
Effective data storytelling depends on visuals. Use bar graphs, pie charts, heatmaps, and trend lines to make patterns more obvious and your message more compelling.
Segmenting Your Audience
Insights often hide in subgroups. Segment your data by age, location, or purchase behavior to tailor conclusions to different user personas.
Performing Sentiment Analysis
Sentiment analysis helps you quantify emotions in open-ended responses. Tools like TextBlob, VADER, or cloud-based APIs can score responses as positive, negative, or neutral.
Building Dashboards for Survey Results
Use tools like Tableau, Power BI, or Google Data Studio to build interactive dashboards. These let stakeholders explore data without needing technical skills.
Benchmarking Against Industry Standards
Compare your results to internal historical data or external industry benchmarks to understand where you stand and identify areas for improvement.
Mapping Insights to Business Goals
Not all insights are actionable. Focus only on those that tie directly into key performance indicators (KPIs) or strategic objectives.
Communicating Insights to Stakeholders
It’s not just what you found, it’s how you say it. Use stories, clear visuals, and real-world implications to convey your message. Always end with a recommended action.
Creating Personas from Survey Data
Aggregate key behavioral and attitudinal traits to build detailed customer personas. This helps personalize marketing and improve customer experience.
Leveraging Predictive Analytics
Go beyond descriptive analytics. Predictive models can forecast trends and customer behaviors based on current survey data, offering a competitive edge.
Avoiding Common Data Analysis Pitfalls
Don’t fall into the trap of confirmation bias, cherry-picking data, or ignoring statistical significance. Keep your analysis honest and objective.
- Validate your assumptions with data
- Use appropriate statistical tests
- Be transparent with limitations
Prioritizing Insights by Impact
Not all findings are equally useful. Rank insights by potential impact, feasibility, and alignment with business strategy.
Building Action Plans from Insights
Once you’ve identified key insights, turn them into concrete action items. Assign ownership, set deadlines, and measure impact over time.
Turning Feedback into Innovation
Customer feedback, when viewed creatively, can spark new product ideas, features, or service models. Keep a backlog of innovative suggestions.
Revisiting and Refining Surveys Regularly
Don’t treat surveys as a one-and-done. Update questions based on learnings from past surveys to continuously improve their effectiveness.
Incorporating Real-Time Feedback Systems
Set up mechanisms for capturing ongoing feedback, such as Net Promoter Score (NPS) surveys or live chat polls, to stay agile and responsive.
Aligning Survey Analysis with Customer Journeys
Map survey responses to the customer journey stages to find drop-off points or pain areas that need attention.
Empowering Teams with Insight Dashboards
Give various departments access to segmented dashboards so they can make decisions based on real data, marketing, support, and product teams alike.
Survey Data to Actionable Insights
The journey from raw survey data to actionable insights isn’t just a technical exercise, it’s a strategic one. It requires the right mix of analytical rigor, business context, and communication skills. Organizations that master this process unlock a competitive advantage, continually optimizing their services, products, and customer experiences. From designing meaningful questions to implementing data-driven strategies, the steps you take with your survey data can pave the way for sustainable growth and innovation.
Conclusion
Converting survey data into actionable insights is more than crunching numbers, it’s about transforming voices into visions. When done correctly, it empowers businesses to make smarter decisions, drive innovation, and enhance customer satisfaction. Follow the process outlined here, stay curious, and keep refining your techniques. The answers are often right in front of you, buried in the data, waiting to be discovered.
Frequently Asked Questions
Find answers to the most common questions about this topic
It allows organizations to understand customer needs, improve services, and make data-driven decisions.
Popular tools include Excel, Google Sheets, Python (Pandas), R, Tableau, and specialized survey platforms like SurveyMonkey or Qualtrics.
Actionable insights are those that relate directly to business goals and suggest clear steps to improve or change something.
Yes, with proper qualitative analysis or text mining, open-ended responses offer deep insights into customer sentiment.
Raw data is unprocessed information; insights are conclusions or implications drawn from analyzing that data.
Use clear visuals, dashboards, storytelling techniques, and focus on key takeaways that align with your stakeholders’ interests.

Author
Bruma